The NHL’s evolution into advanced analytics has transformed how fans, coaches, and analysts understand the game. Gone are the days when goals, assists, and plus-minus told the whole story. In 2025, a new generation of statistics powered by cutting-edge tracking technology reveals the hidden dynamics of hockey—from skating speeds to zone entries, shot quality to defensive pressure. These metrics aren’t just numbers on a spreadsheet; they’re sophisticated models that bridge what happens on the ice with what’s likely to happen based on thousands of previous plays. Understanding these advanced stats means speaking a richer language about hockey, one that captures both the climate and the weather of team and player performance.
The beauty of modern NHL analytics lies in their accessibility. What once required specialized knowledge and insider access is now available to anyone curious enough to explore platforms like NHL EDGE, MoneyPuck, and Evolving-Hockey. These tools transform raw data into actionable insights, helping fans appreciate why certain players excel, why teams win or lose critical games, and how the sport itself continues to evolve. Whether you’re trying to settle a debate about your favorite player or simply want to understand the game at a deeper level, grasping these advanced metrics opens up an entirely new dimension of hockey appreciation.
Understanding expected goals and shot quality in nhl advanced stats explained 2025
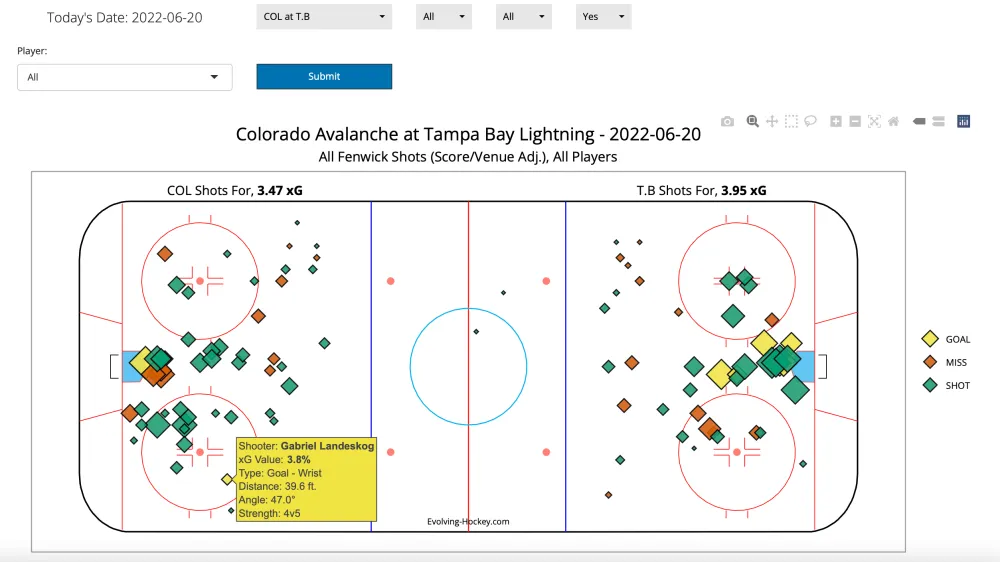
Expected goals, commonly abbreviated as xG, represents one of the most fundamental advancements in hockey analytics. Rather than treating all shots equally, xG assigns a probability to each shot based on historical data about similar attempts. A wrist shot from the slot with a clear sight line carries a much higher xG value than a deflected shot from the blue line. The metric considers distance, angle, shot type, traffic in front of the net, and whether the shot came off a rush or cycle play.
What makes expected goals particularly valuable is its ability to measure shot quality over time. A team might outshoot their opponent 40-25 but lose 3-1 if those 40 shots came from low-danger areas while the opponent capitalized on high-quality chances. Expected goals reveals this discrepancy immediately, showing which team truly controlled the dangerous scoring opportunities. Over the course of a season, teams that consistently generate higher xG than their opponents tend to win more games, regardless of short-term shooting percentage fluctuations.
The 2025 season has brought refinements to xG models, particularly in distinguishing between rush and cycle chances. Analytics expert Micah Blake McCurdy updated his expected goals model to better capture the declining conversion rates of both rush and cycle opportunities. League-wide trends show players are missing the net more frequently than ever before, and rush chances that once converted at higher rates now face more sophisticated defensive schemes. This evolution in the model helps explain why teams built primarily around speed and transition play faced unexpected struggles during recent playoff runs.
Goals Saved Above Expected (GSAx) applies the same principle to goaltending. By comparing the expected goals a goalie faced versus the actual goals allowed, GSAx provides a clear picture of goaltending performance independent of team defense. A goalie posting positive GSAx consistently stops more shots than the model predicts, while negative GSAx suggests below-average performance. This metric has revolutionized goalie evaluation, moving beyond simple save percentage to account for shot quality and difficulty.
Shot location data visualizations now accompany xG metrics on most analytics platforms. Heat maps show where players take their shots and from which locations they’re most dangerous. These visualizations reveal player tendencies—does a sniper consistently find the same spot in the offensive zone, or does a grinder generate chances from the blue paint through net-front presence? Understanding shot quality through expected goals provides context that traditional shooting percentage never could.
Breaking down corsi, fenwick and possession metrics
Possession metrics form the backbone of modern hockey analysis, built on the simple principle that controlling the puck generally leads to better outcomes. Corsi measures all shot attempts—shots on goal, missed shots, and blocked shots—either for or against a team or player when they’re on the ice. Corsi For percentage (CF%) shows what proportion of all shot attempts occurred in a team’s favor, with 50% representing an even split and higher percentages indicating dominant possession.
Fenwick removes blocked shots from the equation, focusing only on unblocked shot attempts. The logic behind this adjustment suggests that blocked shots introduce more randomness into the data—some players and teams block more shots by design, while others employ systems that minimize the need for shot blocking. Fenwick provides a slightly cleaner picture of possession by eliminating this variable, though both metrics serve similar purposes in evaluating territorial control.
These possession metrics proved revolutionary because they’re far more stable and predictive than traditional plus-minus. A player might finish a season at even or minus while posting strong possession numbers, suggesting they were unlucky with shooting percentage or received poor goaltending support. Conversely, a player with impressive plus-minus but poor possession metrics likely benefited from good fortune that won’t sustain over time. The NHL’s tracking data has made these metrics even more sophisticated, incorporating context about game state, zone starts, and quality of competition.
Context matters enormously when evaluating possession metrics. A player starting 70% of their shifts in the defensive zone will naturally face worse possession numbers than someone deployed exclusively in offensive situations. Quality of teammates and opponents also significantly impacts these figures. Advanced stats platforms now display possession metrics with contextual adjustments, showing how players perform relative to expectations based on their deployment and linemates.
The evolution of possession analysis has led to more nuanced metrics like Fenwick Close (possession stats in close game situations, typically within one goal) and Score-Adjusted Corsi (accounting for teams protecting leads or chasing games). These refinements address the reality that teams trailing by multiple goals naturally generate more shot attempts while teams with comfortable leads play more conservatively. Raw possession numbers without this context can mislead, making score adjustments essential for accurate evaluation.
Zone entry and exit tracking transforming nhl advanced stats explained 2025
Manual tracking projects pioneered by analysts like Corey Sznajder revolutionized understanding of transition play. Zone entries and exits—how teams move the puck through the neutral zone—significantly impact offensive generation more than most fans realize. Controlled entries, where a player carries the puck across the blue line with possession, create far more dangerous chances than dump-and-chase entries. Players excelling at gaining the zone with control become invaluable to their team’s offensive system.
The distinction between controlled and uncontrolled entries reveals player value that traditional stats miss entirely. A defenseman who consistently makes clean breakout passes enabling controlled entries contributes significantly to offense without touching the scoresheet. Similarly, forecheckers who disrupt opponent zone exits force turnovers and create offensive opportunities their point totals don’t reflect. Zone tracking data exposes these hidden contributions, painting a complete picture of how players impact territorial play.
Neutral zone play has become increasingly sophisticated as teams recognize its importance. The Florida Panthers’ 2024 championship run showcased aggressive neutral zone forechecking that forced opponents into low-percentage dump entries. Their success prompted league-wide tactical adjustments, with more teams investing in disrupting clean zone entries rather than ceding the blue line. Analytics data tracking these neutral zone battles quantifies their impact on game outcomes.
Zone exit data proves equally revealing on the defensive side. Defensemen who consistently exit their zone with possession—either through skating or accurate first passes—tilt ice time back toward offense. Players forced into frequent icing calls or turnovers at their own blue line leave their team defending more often. The best defensive pairs combine strong defensive zone coverage with efficient puck movement, a combination that zone tracking metrics capture far better than traditional statistics.
Modern tracking technology has automated much of what manual trackers painstakingly recorded, though human tracking projects still provide valuable context. The NHL’s EDGE platform now incorporates zone entry and exit data, making these insights accessible to casual fans through visualized heat maps and player comparison tools. Understanding how players navigate transitions opens up appreciation for the tactical chess match happening between the blue lines.
The battle grid and physicality measurement
Physicality in hockey has always been valued, but quantifying its impact proved elusive until recently. Louis Boulet’s Battle Grid framework, built using data from tracking projects and advanced metrics platforms, attempts to measure physicality in ways that capture actual effectiveness rather than simple hit counts. Being physical matters only when that physicality achieves something positive—winning puck battles, disrupting forechecks, creating offensive chances, or defending dangerous areas.
The Battle Grid incorporates six key categories that collectively define effective physical play. On-puck contact includes hits on the puck carrier and shot blocks, measuring a player’s willingness to engage physically when it matters. Transition against the forecheck evaluates successful puck recoveries under pressure, revealing which players can absorb contact and maintain possession. Checking engagement encompasses puck recoveries and disrupted zone exits, quantifying how forechecking creates turnovers.
Offensive physicality receives equal attention in the framework. Creating offense off the forecheck measures how physical pressure translates to scoring chances, while playmaking down low captures the ability to operate in contested areas behind the opponent’s net. Net-front presence evaluates deflections, tips, and rebounds generated by players willing to pay the price in front of the goalie. Together, these categories paint a nuanced picture of how players use physicality to drive positive outcomes.
Real-world applications of the Battle Grid reveal surprising insights. A player like Jason Robertson demonstrates how physicality metrics can shift dramatically year-to-year. In 2023-24, Robertson rated as excellent across most Battle Grid categories, showing strong forecheck engagement and territorial wins. The following season, his ratings declined significantly—particularly in applying pressure and winning territory in the offensive zone—even as his traditional defensive responsibility remained solid. This fluctuation raises questions about systems, deployment, or individual performance that raw hit totals never would.
The framework also contextualizes physicality relative to player role. Checking engagement that looks impressive for a skill forward might be mediocre for a fourth-line energy player. The Battle Grid accounts for these positional expectations, allowing fair comparisons within player types. What matters isn’t whether a player ranks first league-wide in physical metrics, but whether they leverage physicality effectively given their role and ice time. This nuanced approach transforms physicality from a vague compliment into measurable, analyzable performance data.
Speed, skating metrics and nhl edge technology
NHL EDGE represents the league’s most significant investment in player tracking technology. Using microchips embedded in pucks and shoulder pads, the system captures real-time data on skating speed, distance traveled, zone time, shot velocity, and numerous other metrics impossible to measure manually. Maximum skating speeds show which players possess elite straight-line speed, while average skating speed over a shift reveals who maintains tempo throughout their ice time.
Top skating speeds regularly exceed 23 miles per hour for the league’s fastest players, with breakaway rushes and odd-man situations showcasing raw acceleration. But pure speed tells only part of the story. Players who maintain higher average speeds over full shifts demonstrate superior conditioning and motors. Forwards who consistently skate hard create more transition opportunities through backchecking and forecheck pressure, even if they never appear on highlight reels.
Shot speed metrics captivate fans while providing tactical insights. The hardest slapshots now register above 105 miles per hour, though shot velocity matters less than shot placement and release quickness. The tracking data reveals that many goals come from wrist shots in the 60-80 mph range, where placement and timing matter more than raw power. Understanding when and how players deploy different shot types, captured through EDGE data, helps explain scoring efficiency beyond traditional shooting percentage.
Zone time percentages quantify how players and teams control territorial play. Spending 60% or more of five-on-five time in the offensive zone generally correlates with winning hockey, while being pinned in your defensive zone predicts struggles. Zone time percentages combined with zone starts data show how coaches deploy players—offensive zone specialists see sheltered starts, while defensive forwards and shutdown pairs handle tougher assignments. These metrics validate the eye test while adding precision to subjective observations.
The EDGE platform’s visualizations make this data accessible through daily updates and interactive features. Player comparison tools let fans stack up their favorite skaters side-by-side across numerous categories, from skating speeds to zone time percentages. Heat maps show where players spend their ice time and how they move around the offensive zone. By democratizing access to this technology-driven data, NHL EDGE brings advanced analytics to mainstream audiences rather than keeping it locked behind paywalls or technical expertise.
Defensive metrics beyond plus-minus
Traditional defensive evaluation relied heavily on plus-minus, a deeply flawed stat that fails to isolate individual performance from team effects, shooting percentage luck, and goaltending quality. Modern defensive metrics attempt to capture actual defensive contributions through various approaches. Expected Goals Against measures the quality of chances a player allows when on the ice, providing context about defensive positioning and gap control independent of whether shots actually went in.
Shot suppression metrics track how many shots against a team or player allows per 60 minutes. Players and defensive pairs that consistently limit opponent shot volumes demonstrate strong defensive positioning and active stick work. Combined with expected goals data, shot suppression reveals whether a defender prevents dangerous chances or simply benefits from goaltending bailing out poor defensive positioning. The best defenders both limit shot volume and reduce shot quality.
Neutral zone defense has gained analytical attention as teams recognize its importance. Forcing opponents into low-percentage dump entries rather than allowing controlled zone entries significantly reduces dangerous chances. Defensemen excelling at gap control through the neutral zone disrupt offensive transitions before opponents establish zone time. These contributions rarely show up on scoresheets but materially impact game outcomes by tilting territorial play.
Defensive zone coverage metrics evaluate how players defend dangerous areas. Net-front defense requires physicality and positioning to limit screens, deflections, and rebounds. Slot coverage demands active stick work and awareness to break up passing lanes and deny high-danger opportunities. The Battle Grid framework captures some of these elements, measuring how players defend against tips, deflections, and rebound chances in the crease area.
The challenge with defensive metrics remains isolating individual performance from team systems and quality of linemates. A defenseman paired with a weak partner will face tougher defensive metrics regardless of personal performance. Players on teams with aggressive offensive systems might allow more shot attempts against due to scheme rather than poor defense. Context and eye test verification remain essential when evaluating defensive analytics, ensuring the numbers align with what actually happens on the ice.
Applying nhl advanced stats explained 2025 to roster decisions
Advanced analytics have fundamentally changed how teams approach roster construction and salary cap management. General managers increasingly use possession metrics, expected goals, and other advanced stats to identify undervalued players whose traditional statistics understate their contributions. Players posting strong underlying numbers with poor shooting percentage luck represent buy-low opportunities, while those with inflated point totals despite weak possession metrics might be due for regression.
Contract negotiations now incorporate advanced metrics as players and agents cite possession data, zone entry numbers, and defensive metrics to justify salary demands. A depth forward might lack impressive point totals but provide value through strong defensive zone work, neutral zone forechecking, and penalty kill contributions that analytics quantify. Teams willing to pay for these secondary contributions build deeper, more balanced rosters than those focusing exclusively on offense.
Trade deadline decisions increasingly factor in advanced stats. A struggling player with strong underlying metrics might just need a change of scenery or better linemates, making them attractive trade targets. Conversely, players putting up points despite poor possession numbers might be selling high candidates. Analytical approaches help teams avoid recency bias and small sample sizes, making decisions based on larger data sets and proven correlations between metrics and success.
Draft evaluation has incorporated analytics through prospect projection systems. Junior and European leagues now have tracking data, allowing scouts to evaluate underlying performance metrics rather than relying solely on point production. Prospects demonstrating strong skating metrics, zone entry abilities, and two-way play become more attractive regardless of raw scoring numbers. Teams drafting analytically have found middle-round gems other organizations overlooked.
Fantasy hockey players have embraced advanced analytics to gain competitive edges. Identifying players due for positive regression based on high expected goals and low actual goals helps find waiver wire gems before they break out. Possession metrics predict which players will maintain ice time even during scoring slumps. Shot attempt volumes and shooting percentage trends help project future scoring, turning advanced stats into actionable fantasy decisions that traditional statistics miss.
The integration of advanced statistics into NHL analysis represents far more than a trend—it’s a fundamental shift in how we understand hockey. These metrics don’t replace the eye test or diminish the importance of intangibles like leadership and clutch performance. Instead, they provide language and framework for articulating what we observe, separating sustainable performance from random variation, and appreciating contributions that traditional box scores overlook.
As tracking technology continues advancing and analytical methods grow more sophisticated, fans who embrace these tools gain richer appreciation for the sport’s complexity. Whether you’re debating player value, evaluating your favorite team’s roster decisions, or simply trying to understand why certain games unfolded as they did, advanced statistics offer answers grounded in data rather than subjective opinion. The 2025 season showcases how far hockey analytics have come, transforming from niche interest to mainstream conversation. The question isn’t whether to pay attention to these metrics, but how quickly you’ll start incorporating them into your own hockey vocabulary.
Par Mike Jonderson
Mike Jonderson is a passionate hockey analyst and expert in advanced NHL statistics. A former college player and mathematics graduate, he combines his understanding of the game with technical expertise to develop innovative predictive models and contribute to the evolution of modern hockey analytics.